1. Objective
The objective of this project was to design and build a complete analytics engineering workflow using modern tooling.
Rather than focusing solely on reporting, the aim was to model data correctly, apply engineering practices such as testing and documentation and deliver a dimension model suitable for analytics.
2. Source Data
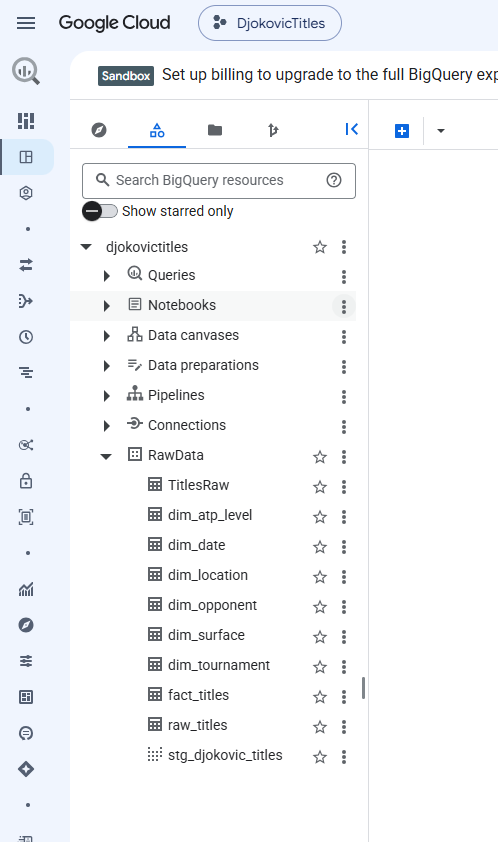
The source data was a Google Sheet I created containing details of every ATP (Association of Tennis Professionals) title won by Novak Djokovic during his illustrious career.
3. Architecture
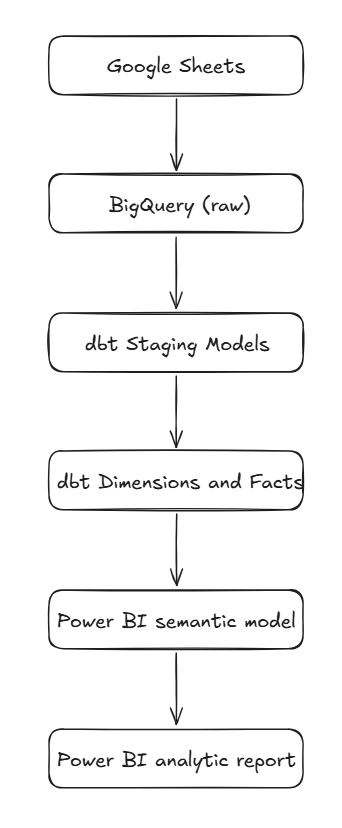
The architecture was layered from source to ingestion to presentation in the following manner:
3.1 Data Warehouse
3.2 Transformation Layer
3.3 Presentation Layer
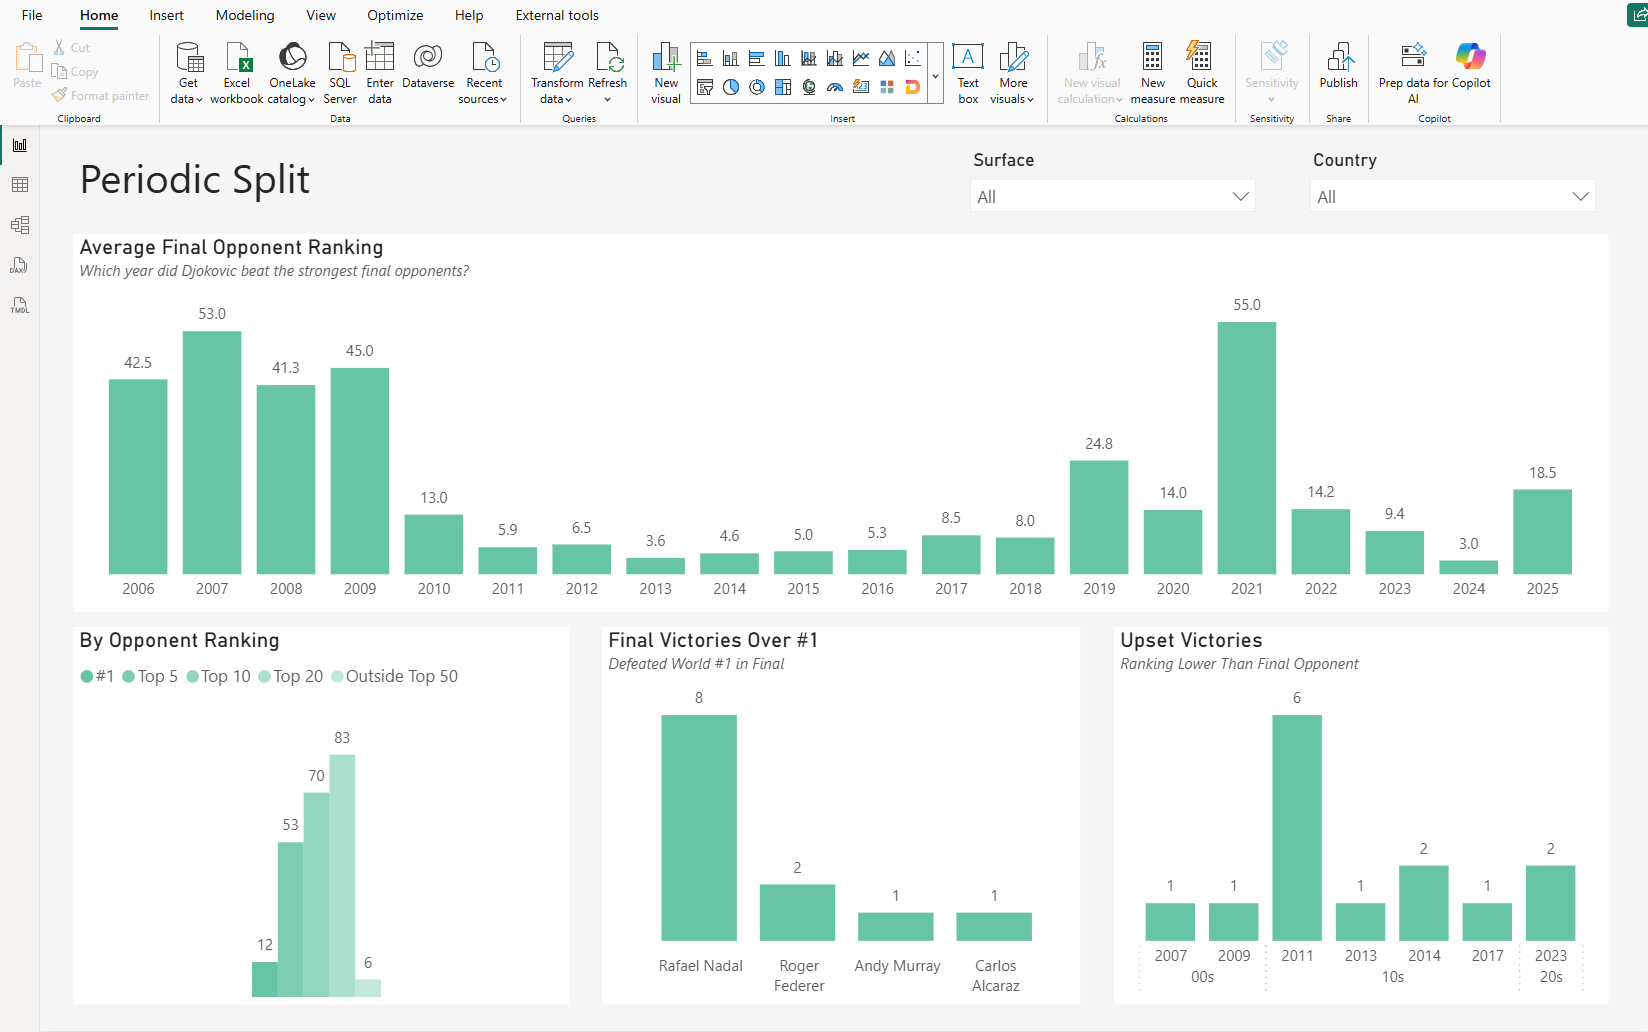
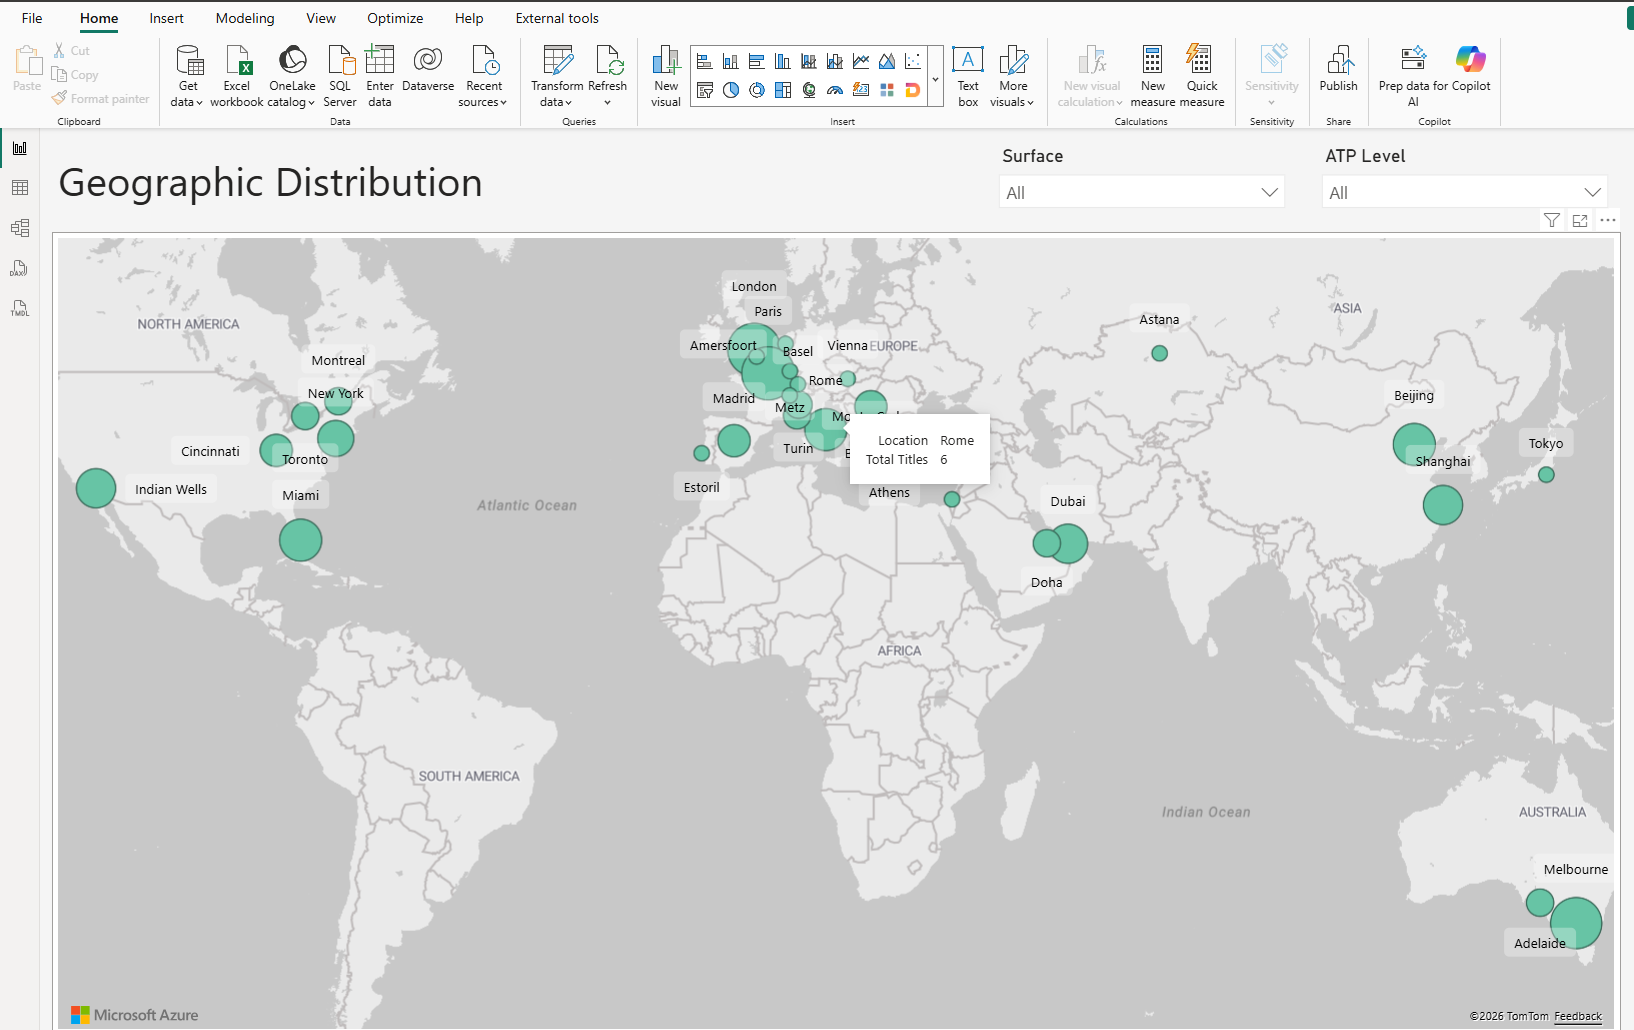
4. Key Elements
- Source data ingested from Google Sheets into BigQuery.
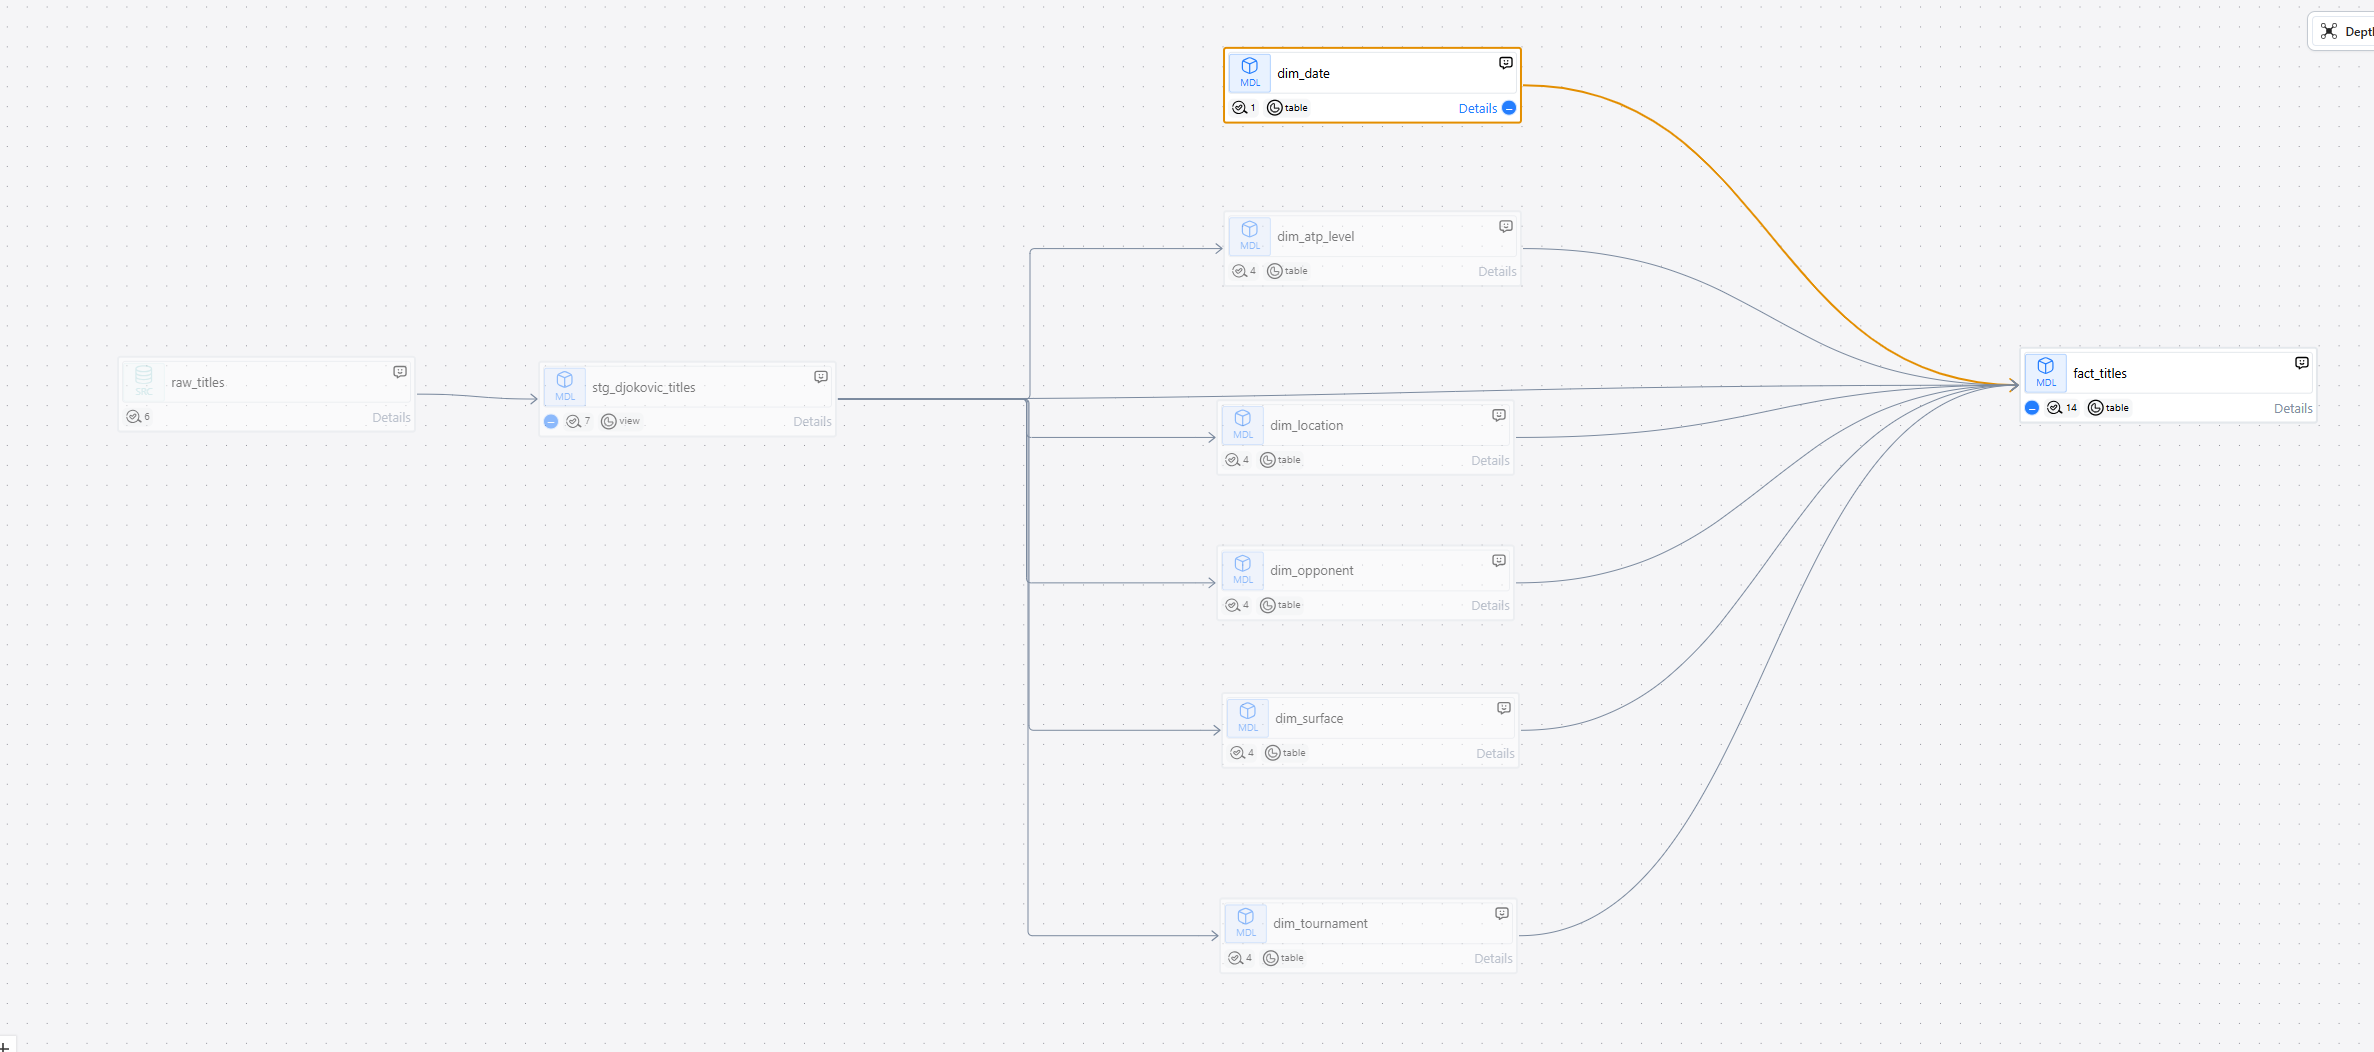
- Raw data standardised through dbt staging models.
- Star schema designed with dimensional attributes and a central fact table.
- Surrogate keys generated for all dimensions.
- dbt tests implemented to validate data quality.
- Documentation generated directly from the dbt project.
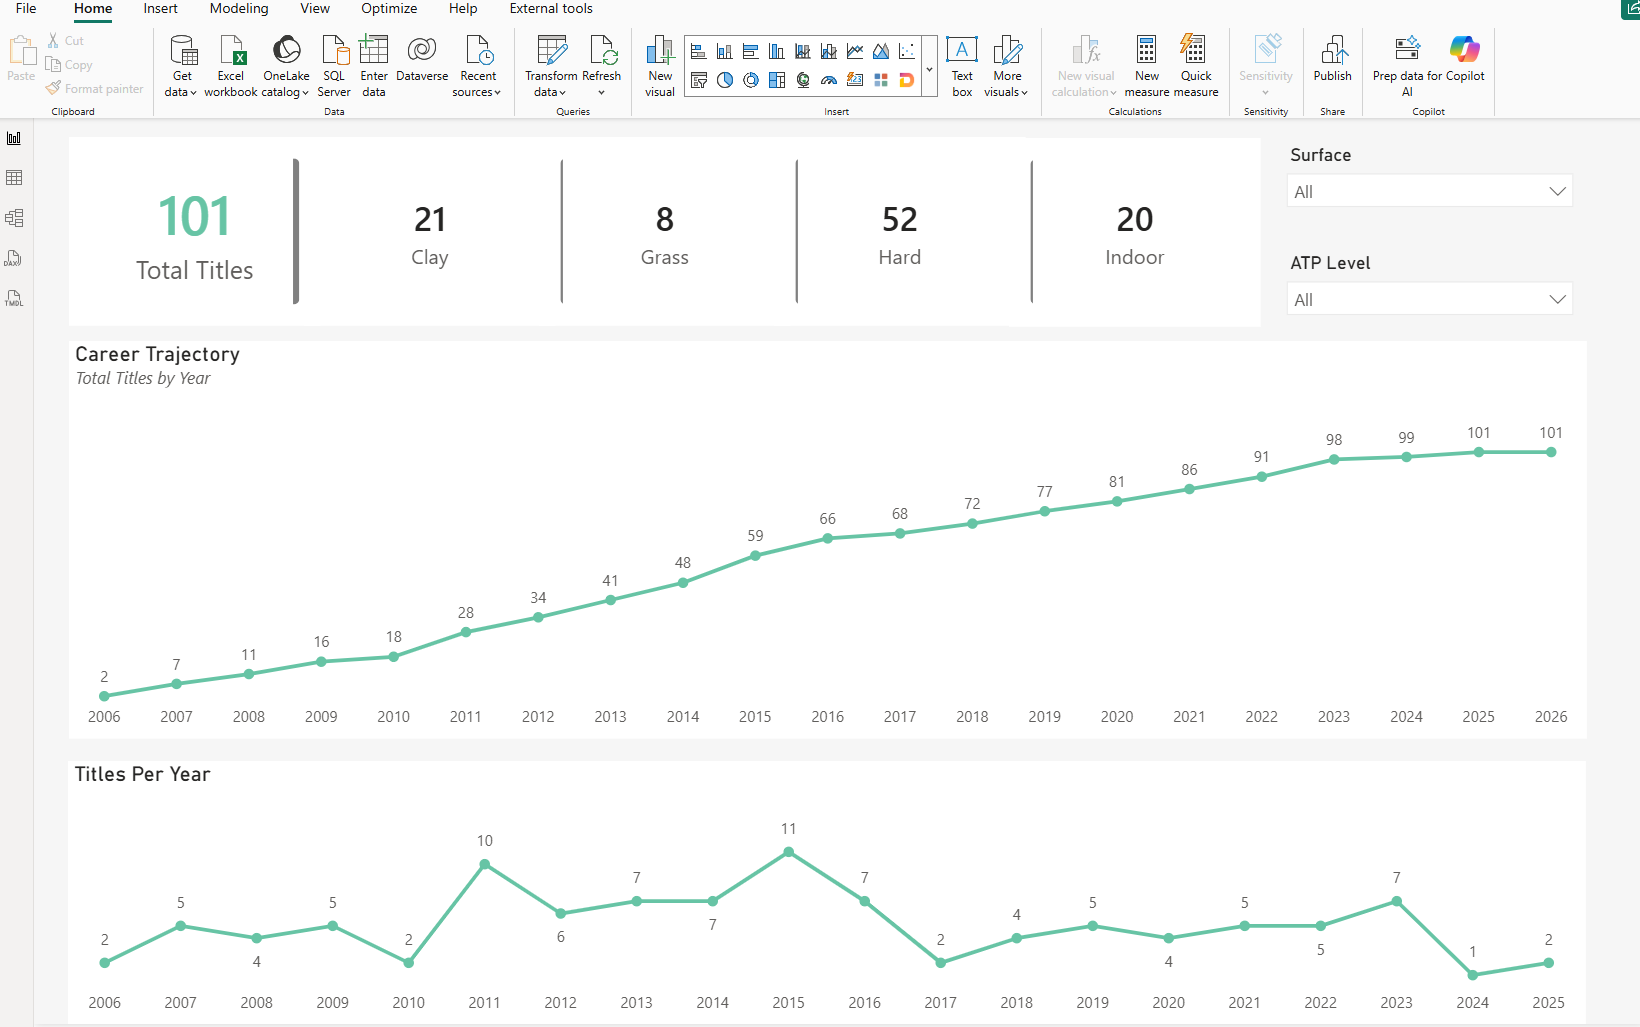
- Final dimensional model consumed by Power BI.
- Development followed a Git-based workflow with the dbt project maintained in GitHub.
5. Technologies
The technologies used were as follows:
- BigQuery
- dbt core
- SQL
- Git
- Visual Studio Code
- Power BI
6. Engineering Concepts Used
The following concepts were either used or explored during the course of the project:
- Dimensional modelling
- Automated ingestion pipelines via scheduled query
- Surrogate key generation
- Data quality testing
- Documentation generation
- Transformation layering
- Analytics engineering workflow
7. Challenges
The following were challenges that arose and needed to be overcome during the project:
- Designing a dimensional model from scratch.
- Choosing where certain transformations belonged in the pipeline.
- Understanding dbt views and tables.
- Managing BigQuery sandbox limitations.
- Deciding where testing should occur.
- Generating surrogate keys.
- Building reusable dimensions.
- Learning the BigQuery SQL dialect.
8. What I Learned
Prior to this project the bulk of my experience was in Power BI semantic modelling. Building an analytics engineering pipeline demonstrated that reliable reporting begins much earlier that the reporting layer.
Data ingestion, dimensional modelling, automated testing, documentation and version control all contribute to a maintainable analytics engineering pipeline.
9. Key Skills Demonstrated
| Area | Skills |
|---|---|
| Data Warehousing | Kimball dimensional modelling |
| SQL | BigQuery SQL |
| Analytics Engineering | dbt Core |
| Data Quality | Source and model tests |
| Documentation | dbt Docs |
| Version Control | Git / GitHub |
| Reporting & Visualisation | Power BI |
| Development | VS Code |